
RESEARCH
Searching for unknown meteorite craters in Japan
In Japan, Mt. Oikeyama in Nagano Prefecture has been reported as a meteorite crater. Between 2025 and 2026, red relief image maps of the entire country became available for anyone to view. This research applies processing verified on known impact structures around the world to the whole of Japan to find craters that remain undiscovered. Methods and progress are published on this page.
QUESTION
Research question
More than 200 structures formed by meteorite impacts have been confirmed worldwide. In Japan, Mt. Oikeyama in Nagano Prefecture has been reported as a meteorite crater (Sakamoto et al. 2010). Japan is a steep, mountainous country whose landforms are readily altered by rain and forests. Other craters may therefore have been overlooked.
The Oikeyama structure is a semicircular landform about 900 m across on the mountain's south-eastern slope, taking in the summit, and its origin has long been debated. Shock-metamorphic features in quartz were reported in 2005, and a negative gravity anomaly of about 2 mGal in 2010. Research on Oikeyama, too, began with its semicircular landform.
In recent years, 1 m elevation data from airborne laser scanning have been produced across Japan, and red relief image maps, which make terrain easy to read, now cover the whole country. Examining all of Japan by eye is not feasible, which makes machine learning essential. This research combines processing verified on known impact structures with machine-learning classification to examine the entire country.
Meteorite crater in Japan
Mt. Oikeyama (Iida, Nagano)
- Location
- Western foot of the Akaishi Mountains; the south-eastern slope including the summit of Mt. Oikeyama (1,905 m)
- Form
- Semicircular, about 900 m across (about 40% of the circle remains)
- Evidence
- Shock-metamorphic planar deformation features (PDFs) in quartz; a negative gravity anomaly of about 2 mGal (114 stations)
- Literature
- Sakamoto et al. 2005 (LPSC XXXVI); Sakamoto et al. 2010 (Meteoritics & Planetary Science 45); Sakamoto & Shichi 2010 (Planetary People 19, Japanese Society for Planetary Sciences)
Recent public data in Japan
- 2002Tatsuro Chiba and colleagues at Asia Air Survey devised the red relief image map. A single image shows slope together with the ridge-valley index, derived from above-ground and below-ground openness.
- 2023The Geospatial Information Authority of Japan (GSI) began providing 1 m elevation data from airborne laser scanning (DEM1A). The patent on the red relief image map expired the same year.
- 2025In June, a red relief image map of all of Japan became viewable in a web browser on Q-chizu, a nationwide web map service. In October, DEM1A coverage reached about 61% of Japan's third-level mesh cells.
- 2026In February, the Forestry Agency began publishing forest elevation data from airborne laser scanning, along with micro-topography maps. DEM1A coverage expanded again in February and July.
Sources: Chiba et al. 2007 (Chizu 45(1)); Chiba 2026 (announcement of a Tokyo Geographical Society special lecture); GSI announcements (March and October 2025) and the DEM1A update history; Q-chizu documentation; Forestry Agency material (March 2026).
Wider applications
The inventor of the red relief image map has said that it may help AI, as well as people, pick out landform features (Chiba 2026). The methods of this research also apply to the following fields.
- OverseasThe same processing and classification can be applied in any country or region with public high-resolution elevation data.
- The MoonRed relief image maps have been made for craters on the far side of the Moon (Chiba 2026, from Kaguya laser altimeter data).
- ArchaeologyRed relief image maps are used to find burial mounds hidden under forest. In Okuizumo, Shimane Prefecture, 77 newly found keyhole-shaped mounds were reported (San'in Chuo Shimpo, 2023).
METHOD
Research method
The research proceeds in four stages. First, we establish which observations are available in Japan and how good they are. Second, we apply the same processing to known impact structures worldwide, matched to that quality. Third, we build a machine-learning classifier that misses no known impact structure. Finally, we apply it to the whole of Japan. Every dataset and process we use is public.
-
I
Establish the quality of Japan's observations, place by place
- Data
- GSI digital elevation models (DEM1A to DEM10B); indexes of coverage and survey years; public survey records; ground gravity data; aeromagnetic anomaly data for Japan
- Work
- We catalogue the observations and processes that can be applied to the whole of Japan, recording how each is made, its resolution and its accuracy, and citing the distributor's documentation for each. For elevation data, we trace each location back to the specific survey and year it comes from.
- Results
- We compiled a catalogue of 90 observation series and 44 process groups, with 95 sources. We confirmed that Oikeyama's 1 m elevation data come from an airborne laser survey conducted by Nagano Prefecture in fiscal 2022 for erosion-control planning.
-
II
Apply the same processing to known impact structures worldwide
- Data
- A worldwide inventory of impact structures (354 entries); public 1 m-class elevation data from the United States, Canada, Estonia and Germany
- Work
- We make red relief image maps with the same formulas and constants as Q-chizu. Elevation data from abroad are converted to the same tile grid as Japan's before processing. One pixel is about 0.98 m at 35°N, and the openness search radius is 50 pixels. Each structure is scaled to its diameter, then measured by distance from its centre.
- Results
- We prepared elevation data and made red relief image maps for 48 structures in four countries. Of these, 43 were processed with the same formulas and constants as Q-chizu, and 39 were scaled to diameter and measured.
-
III
A classifier that misses no known impact structure
- Data
- Outputs of stage II; gravity, magnetic and geological data
- Work
- The classifier is evaluated on known impact structures deliberately held out of training: it must identify them as impact structures without being told their location or type. The criterion is that not a single known structure is missed. Gravity, magnetic and geological data are combined with the red relief image maps.
- Objective
- To detect, without prior information, even heavily eroded mountain structures like Oikeyama.
-
IV
Apply to the whole of Japan
- Data
- More than one million elevation tiles covering Japan (Q-chizu); nationwide gravity, magnetic and geological data
- Work
- The same processing and classifier are applied to the whole of Japan in one pass. As 1 m elevation coverage expands, so does the area we can examine.
- Objective
- To select, from the detected candidates, sites to confirm by geological fieldwork. Evidence of impact includes shocked quartz.
What “the same processing” means
A red relief image map multiplies two images together (Chiba et al. 2007). One shows slope as the saturation of red. The other shows the ridge-valley index as brightness. The ridge-valley index is half the difference between above-ground and below-ground openness: high on ridges, low in valleys.
In this research, we identified Q-chizu's computation down to its formulas and constants, and matched our own processing to it. Elevation data for structures abroad are converted to the same tile grid as Japan's before processing. When comparing, we align not only the formulas and constants but also the version of the input elevation data, the grid, the search radius and the quality of the original observations.
Source: Chiba, T., Suzuki, Y. and Hiramatsu, T. 2007. [Problems in topographic representation and the red relief image map]. Chizu (Map) 45(1): 27–36 (in Japanese).
DATA
Data sources
Processing and classification use only observation data published by public agencies and published catalogues of impact structures. How each dataset is made, and its resolution, are taken from the distributor's own documentation.
Observation data for Japan
| Dataset | Provider | Resolution | Coverage |
|---|---|---|---|
| Digital elevation model DEM1A (airborne laser scanning) | GSI | 1 m | About 61% of third-level mesh cells nationwide (October 2025), and expanding |
| Digital elevation models DEM5A, DEM5B, DEM5C | GSI | 5 m | By region |
| Digital elevation model DEM10B (from 1:25,000 topographic map contours) | GSI | 10 m | All of Japan |
| Red relief image map and elevation tiles | Q-chizu | Finest available at each location (0.5–10 m) | All of Japan |
| Forest airborne-laser elevation data and CS relief maps | Forestry Agency and prefectures | 0.5 m class | Surveyed areas (published from February 2026) |
| Index of coverage and survey years; public survey records | GSI | Per survey | Nationwide |
| JGSN2016 ground gravity data | GSI | About 14,000 stations | Nationwide |
| Gravity Database of Japan (public station data) | Geological Survey of Japan, AIST | About 170,000 stations | Nationwide |
| Aeromagnetic anomaly data for Japan | GSI | 3′ latitude–longitude grid (observed 1984–1998) | Nationwide |
| Seamless Digital Geological Map of Japan 1:200,000 (V2) | Geological Survey of Japan, AIST | 1:200,000 | Nationwide |
Data for known impact structures abroad
| Dataset | Provider | Resolution | Coverage |
|---|---|---|---|
| 3DEP (The National Map) | U.S. Geological Survey (USGS) | 1 m | United States |
| HRDEM (High Resolution Digital Elevation Model) | Natural Resources Canada | 1 m | Canada |
| Digital terrain model | Estonian Land Board (Maa-amet) | 1 m | Estonia |
| DGM1 | Bavarian State Office for Digitisation, Broadband and Surveying (LDBV) | 1 m | Bavaria, Germany |
| DGM1 | State Office for Geoinformation and Land Development Baden-Württemberg (LGL) | 1 m | Baden-Württemberg, Germany |
| Impact structure catalogues | Earth Impact Database (PASSC); Impact Earth | Per structure | Worldwide (merged into a 354-entry inventory) |
Resolution is the grid spacing of the distributed data or the number of stations. Coverage is as of October 2026.
RESULTS
Results
We processed known impact structures around the world in the same way as Japan's red relief image map and set them side by side. Every map on this page was made from public elevation data.
354entries
An inventory of impact structures worldwide, including control sites and rejected candidates for comparison. Of these, 240 structures are linked to 2,011 papers (by DOI).
48structures
Known impact structures with red relief image maps made from public 1 m-class elevation data in four countries. Of these, 43 were processed with the same formulas and constants as Q-chizu.
36/ 36 tiles
At Oikeyama, all 36 tiles matched Q-chizu's computation to within one level in each RGB channel.
28 known structures side by side
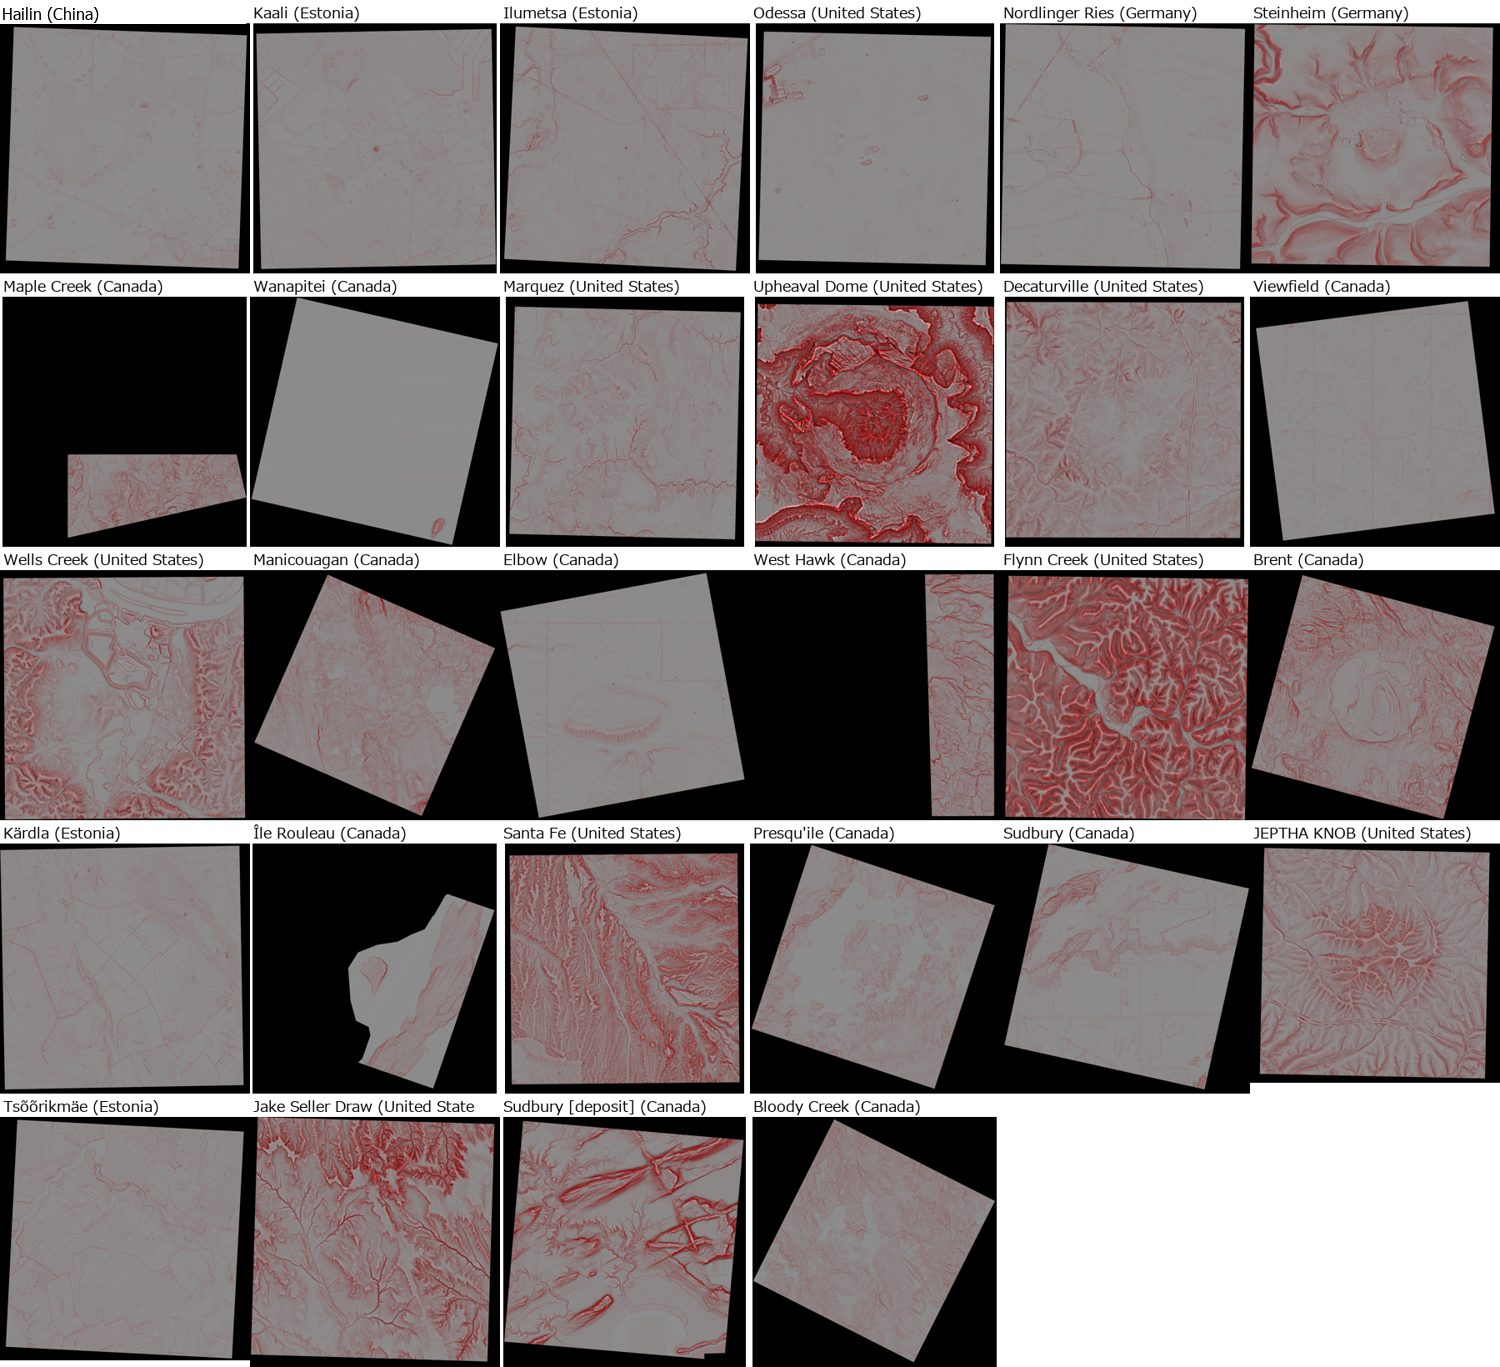
Scaled to diameter
Scaled to their diameters, structures from a 40 m pit to the 4 km class can be compared on the same footing. Seven of the 39 structures scaled this way are shown here.
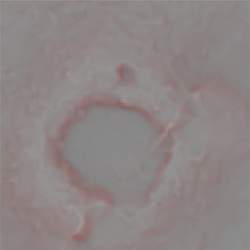
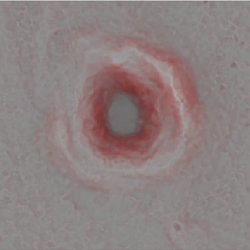
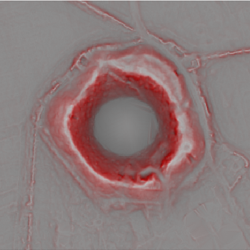
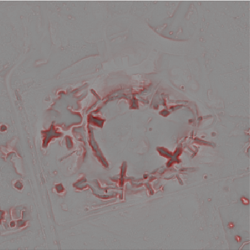
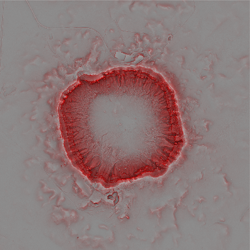
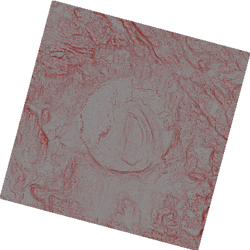
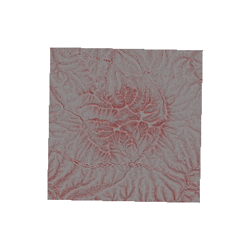
Each panel spans twice the structure's diameter, north up. Diameters are from the inventory. Made from public 1 m-class elevation data from the Estonian Land Board, the U.S. Geological Survey (3DEP) and Natural Resources Canada (HRDEM).
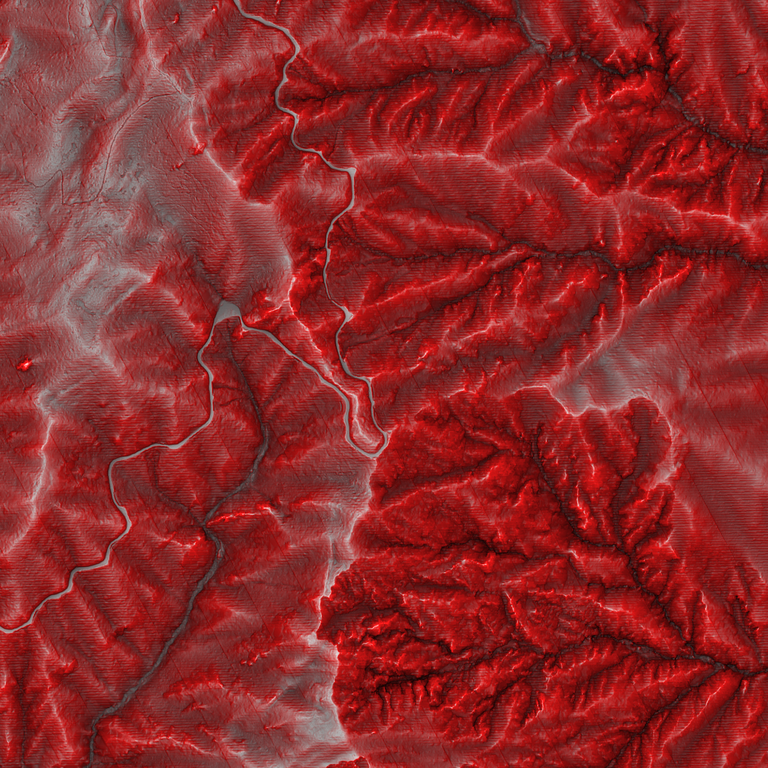
Verification at Oikeyama
At Oikeyama, we confirmed that our processing for Japan produces the same image as the nationwide red relief image map.
- Input
- The central 36 GSI DEM1A elevation tiles (zoom 17), about 1.8 km square
- Comparison
- An image from our own processing, and an image from Q-chizu's colour computation applied to the same elevation
- Result
- In all 36 tiles, the per-pixel RGB difference was at most one level (out of 256).
Checking Japan's public observations
The quality of the observations that form Japan's baseline is checked against primary sources.
- MagneticsAeromagnetic data over Japan's land area were acquired in surveys from 1981 to 1983, with main lines 3–4 km apart, tie lines 20 km apart and a constant altitude of about 1,372 m above sea level. We confirmed this in the original 1985 report.
- GravityWe used 14,029 GSI ground gravity stations and 173,365 public stations from AIST, counting the stations around each of 95,484 evaluation points spaced 0.02° apart over land. From the counts, we produced a nationwide map of station density.
- 1 m elevationStarting from the GSI index, we traced Oikeyama's 1 m elevation data to the original public survey record: an 854 km² airborne laser survey conducted by Nagano Prefecture in fiscal 2022 for erosion-control planning.
- Source textsWe read the original texts of the GSI Fundamental Geospatial Data FAQ, the documentation of the aeromagnetic anomaly data for Japan, the JGSN2016 ground gravity data manual and AIST's documentation of the Gravity Database of Japan. The figures are checked against these texts.
RECORD
Research record
The progress of the research is recorded with dates in a version-control system (git). Key milestones are listed below.
- Records
Research records consolidatedWe brought the records of earlier trials together in one place and reviewed them against primary sources. All methods and progress since then are recorded there.
- Survey
Oikeyama in the original reportsWe read the original reports on Oikeyama, reported as a meteorite crater in Japan (Sakamoto et al. 2005; Sakamoto & Shichi 2010), and checked the evidence they present. We confirmed the method for making red relief image maps in the inventor's original paper (Chiba et al. 2007). We also checked GSI's original documents for how its elevation data are produced and how far they extend.
- Processing
Japan and abroad, side by sideWe consolidated the worldwide inventory of impact structures into 354 entries. We processed three structures, including Kaali, from Estonian 1 m elevation data, and applied the same processing to Oikeyama's 1 m elevation data. With this, known structures in Japan and abroad were set side by side under the same processing for the first time in this research.
- Data
Elevation data from each countryWe built a tool that downloads 1 m-class elevation data from each country's distributor, and completed downloads for 46 areas.
- Papers
Paper inventoryDrawing on Crossref and xDD, we linked 2,011 papers (by DOI) to 240 of the 354 entries. Research records, structures and papers were organised into individual cards.
- Verification
Match with the nationwide mapWe identified Q-chizu's computation down to its formulas and constants and matched our own processing to it. Across all 36 tiles at Oikeyama, the difference was within one level in each RGB channel.
- Processing
28 known structures side by sideWe applied the same processing as Q-chizu to known structures abroad and produced the first figure lining up the results.
- Processing
Scaled to diameterWe lined up 39 structures, each scaled to its diameter. Structures from a 40 m pit to the 4 km class can now be compared on the same footing.
- Survey
Catalogue of Japan's observationsWe catalogued 90 observation series and 44 process groups applicable to the whole of Japan, with 95 sources.
- Survey
Quality of observationsWe examined gravity station density across Japan at 95,484 evaluation points, confirmed the aeromagnetic line spacing in the original report, and traced Oikeyama's 1 m elevation data to their public survey record.
As of 7 October 2026, the research record holds 292 commits.
CLAUDE
Claude's role
This research is run with Anthropic's Claude (Claude Code) in a supervisory role. People set the research questions and make the final decisions. Claude's main responsibilities are as follows.
- Research designClaude breaks the research question into stages and designs what is compared at each stage, and how.
- Source checksFigures that decisions rest on are checked against the original papers, survey records and distributors' documentation. Figures confirmed in the originals are recorded with their sources, kept distinct from figures taken from other investigations.
- Meaning of dataClaude establishes from the original documents what “1 m elevation” is derived from and how much of it is directly measured. Based on a pixel-by-pixel comparison of Q-chizu and GSI DEM1A elevations (a mean difference of 0.46 m at Oikeyama), it chose Q-chizu's elevation as the input for Japan.
- Processing checkBecause Q-chizu computes its map in the browser, Claude determined that the formulas and constants were in its source code and had them identified. With our own processing matched to them, Claude reviewed the results of comparing the images the two processes produce from the same elevation data.
- Briefs and reviewClaude writes the briefs for long investigations and implementation work, and the instructions for jobs run on our PCs. It reads the results that come back, checks the key points against primary sources, and records each decision to accept or reject them.
COLLABORATION
Research collaboration
We welcome researchers who would like to test this method with us. Whether your expertise lies in interpreting terrain, gravity or magnetic data, in field study of known impact structures, or in verifying candidate sites, please get in touch at any stage.